
When Filters Fail: A Case Study in Catalog Navigation
February 3, 2026 · 13 min read
How product data problems compound to create customer experiences that look helpful but don’t work.
The Search
A maintenance supervisor needs cut-resistant gloves for a sheet metal fabrication line. Her team lead specified ANSI A4 cut protection after a near-miss incident last quarter. She knows what she’s looking for: A4 cut level, nitrile coating, size large, in stock for fast delivery.
She searches “cut-resistant gloves” on a major industrial distributor’s website.
5,500+ results.
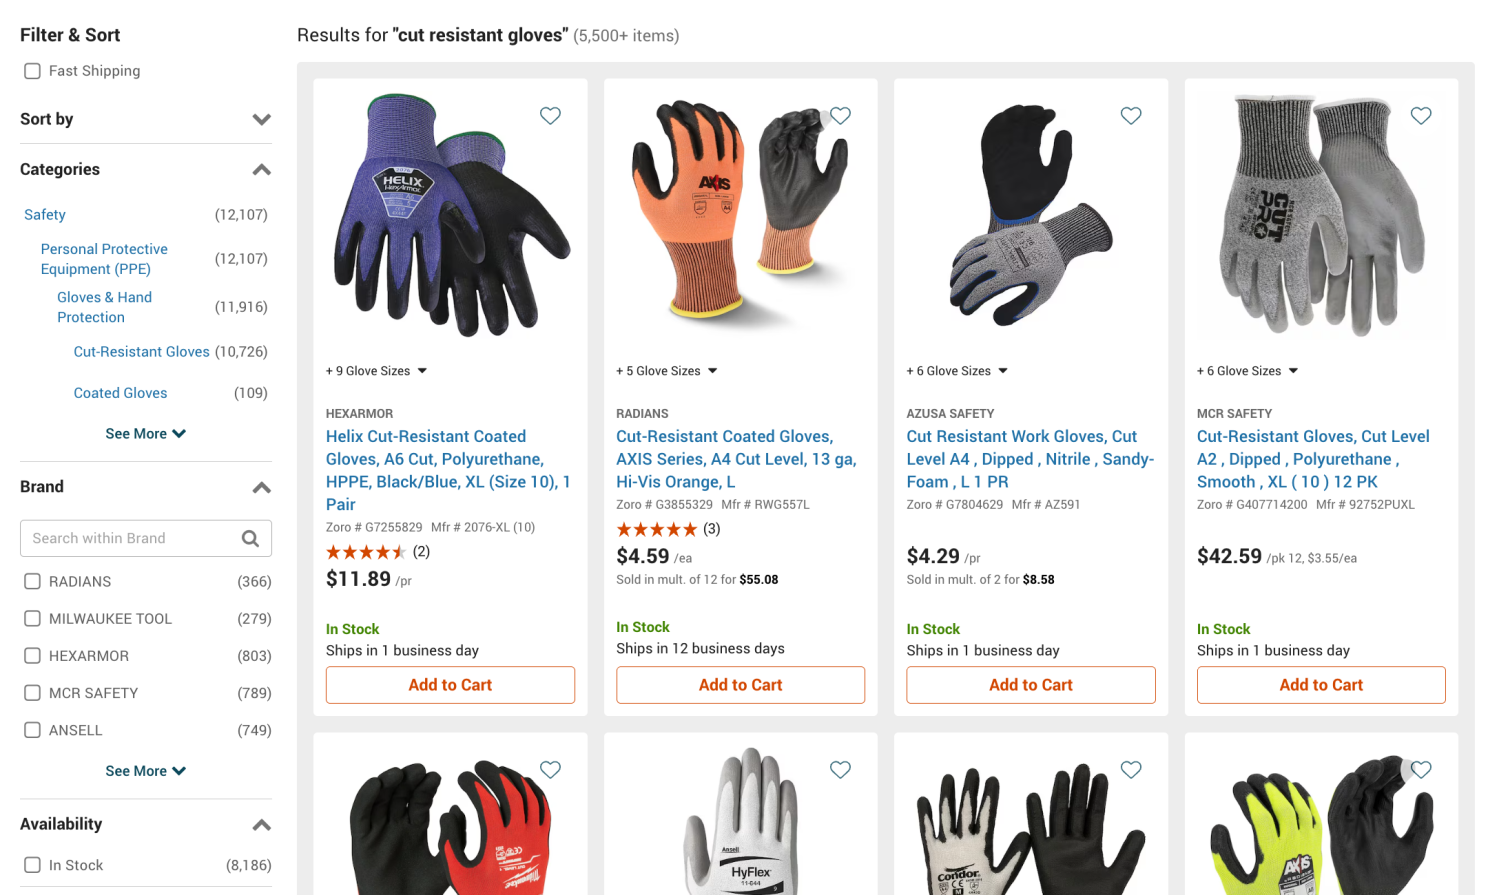
5,500+ results. That’s what filters are for … except when filters themselves are a problem.
No problem, that’s what filters are for. She starts narrowing.
But as she works through the filter panel, something becomes clear: the filters themselves are a problem.
Problem 1: Category Mismatch
Look at the Categories section in the filter panel. The search returned “5,500+ items,” but the Cut-Resistant Gloves category shows 10,726 SKUs.
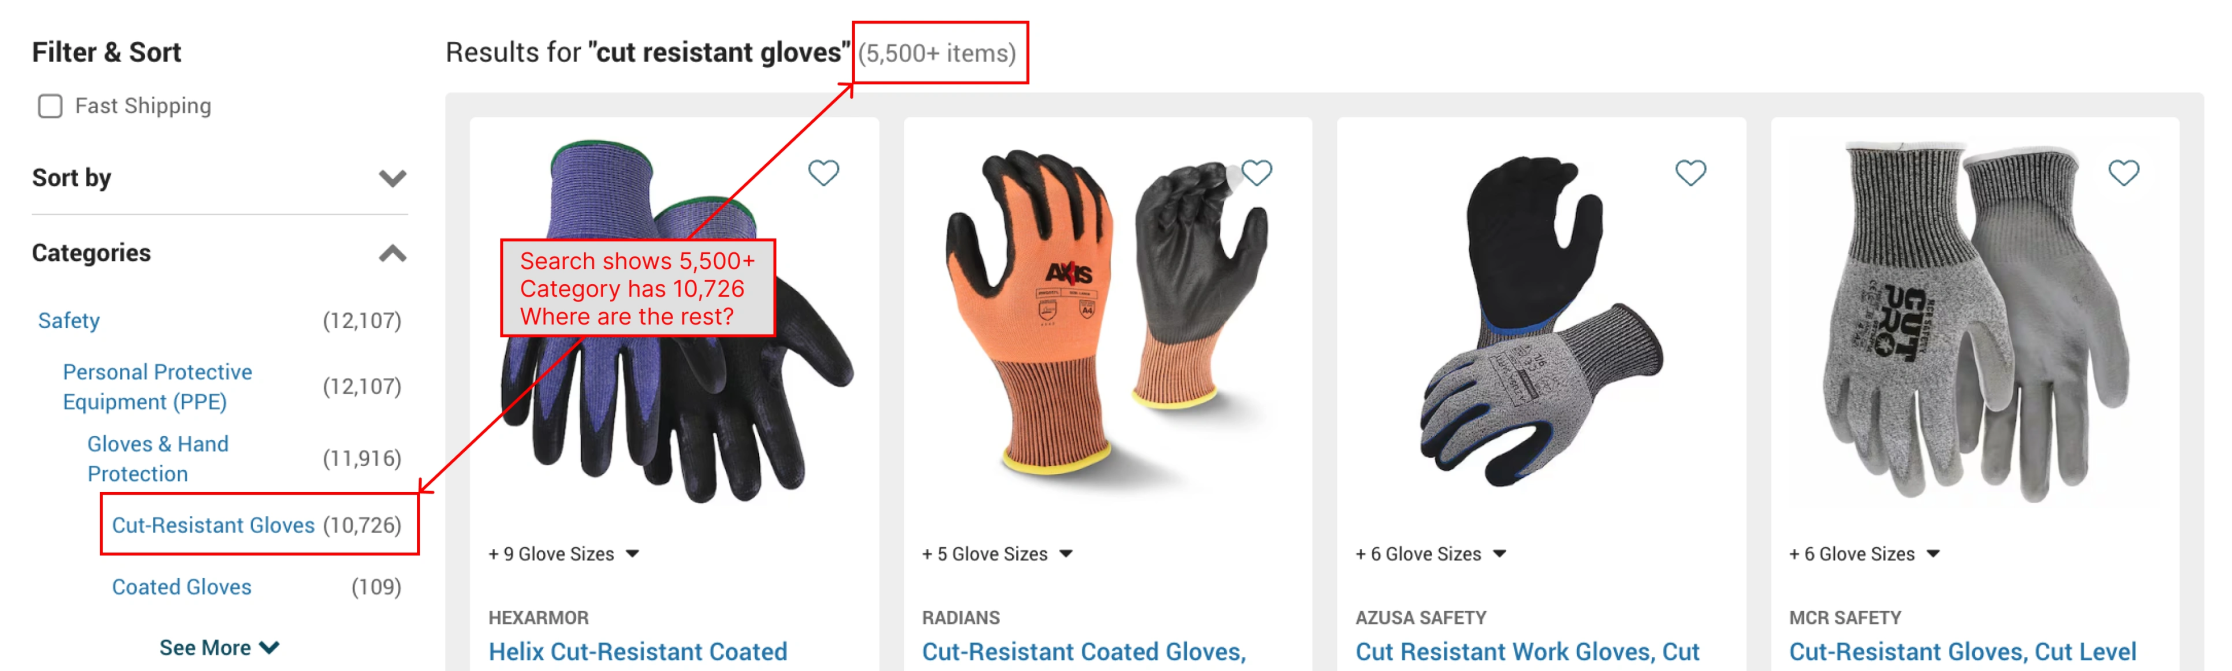
Where are the other 5,000+ products?
The customer can see this mismatch and it raises an obvious question: where are the other 5,000+ products?
The system offers no explanation. Are they out of stock? Less relevant? Excluded by some invisible filter? The customer has no way to know. If she wants to see the full assortment, she has to click into the category separately, a second navigation step that many customers won’t think to take.
A search for “cut-resistant gloves” should surface everything relevant. Instead, it surfaces a subset, displays evidence that more products exist, and leaves the customer to figure out what’s happening.
Problem 2: Unsorted Brands
Our maintenance supervisor wants to filter to BDG, the brand her team has used for years and knows fits well.
She opens the Brand filter and finds 100+ manufacturers listed in no discernible order.
Not alphabetical. Not sorted by number of products. BDG has 1,476 products – more than any brand visible near the top of the list – but appears several scrolls down, buried in what seems to be random order.
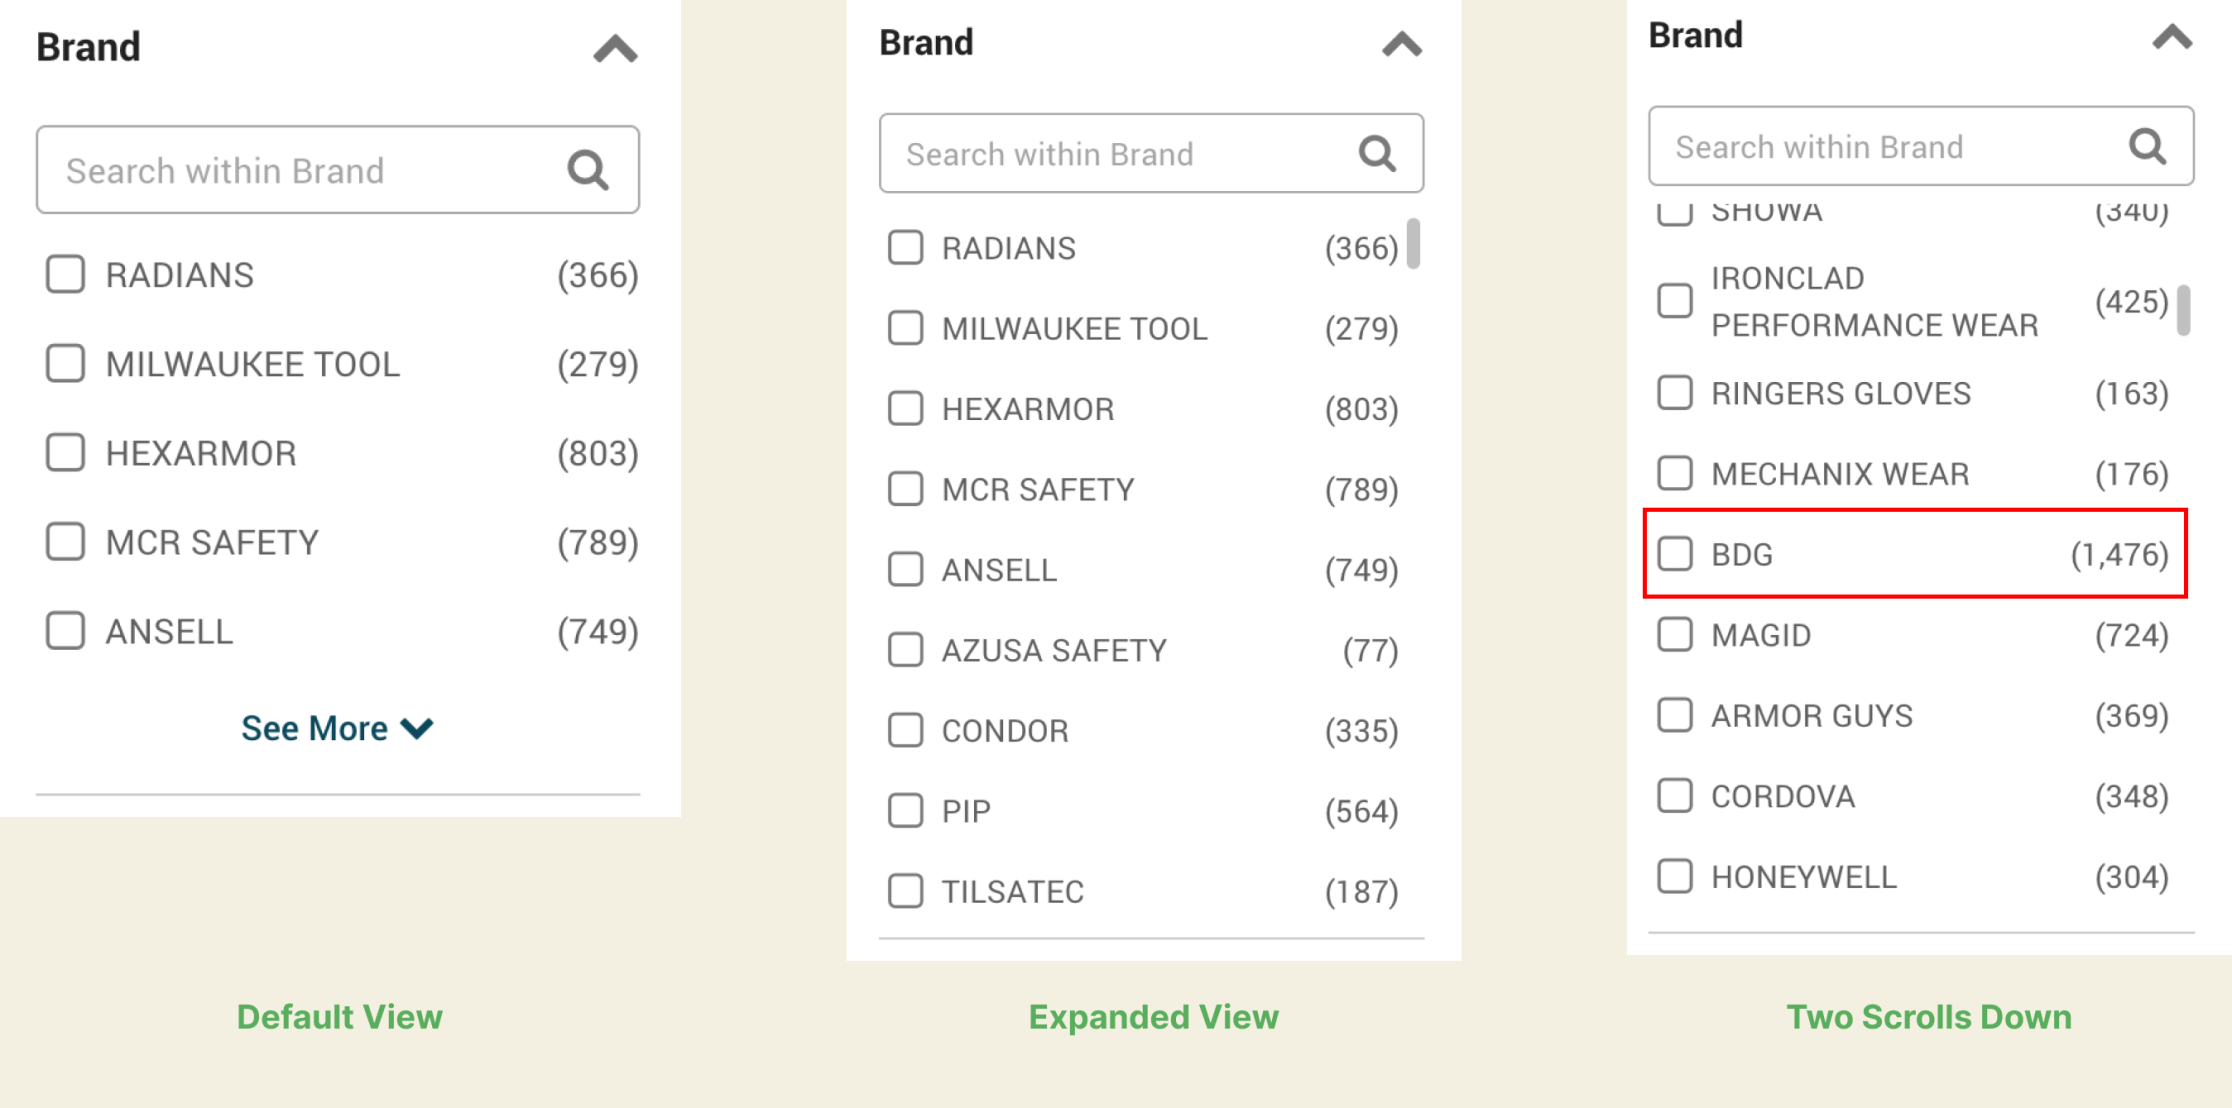
BDG has 1,476 products – more than any brand shown at the top – but appears two scrolls down in no discernible order.
If you know what brand you want, you can’t find it without scrolling through the entire list or using a search box (if you notice one exists). If you don’t know what brand you want, the random ordering provides no guidance about which brands have the deepest selection or might be worth exploring.
What this filter should do: Either alphabetize (so buyers can jump to their brand) or sort by SKU count (so buyers can see which brands have the deepest selection).
What it actually does: Neither. It presents brands in whatever order the system stored them.
Good filters should match how customers actually think about products. No buyer thinks about brands in random database order.
Problem 3: Unnormalized Sizes
Our supervisor needs size Large. She checks the Glove Size filter.
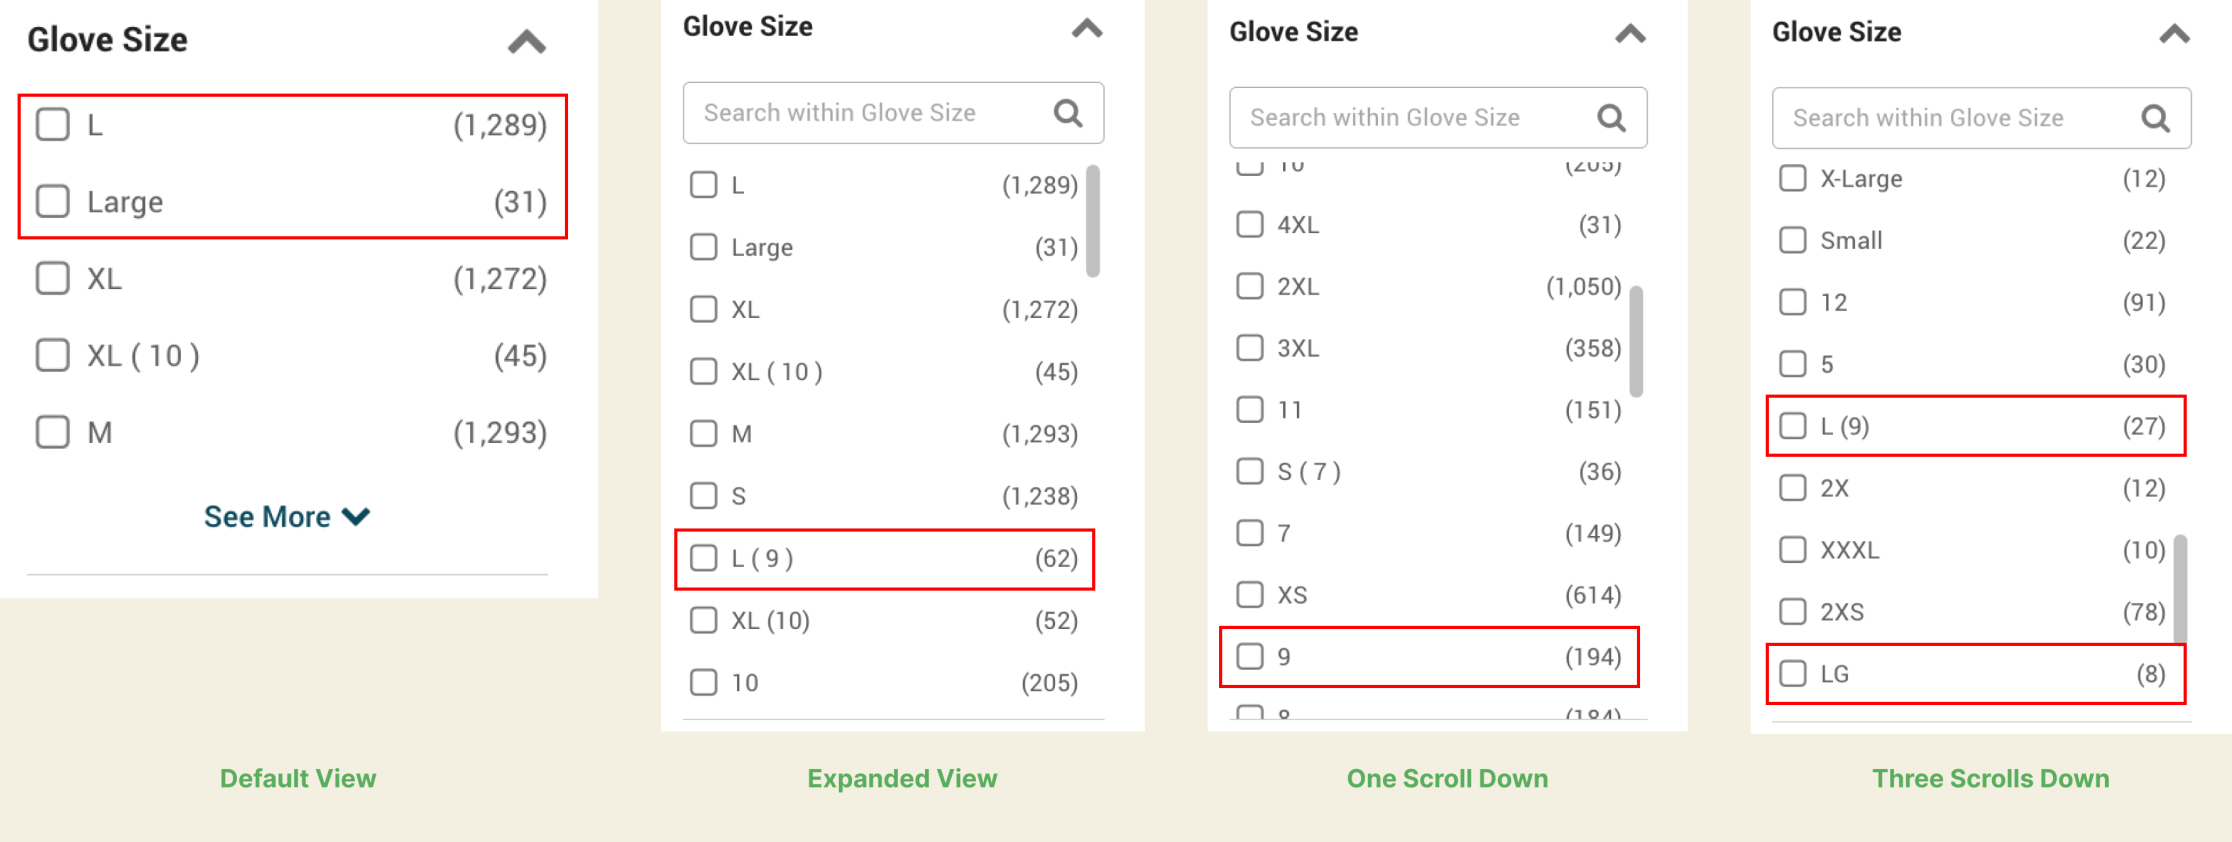
“L,” “Large,” “L (9), “9” and “LG” all represent overlapping size values, but selecting any one excludes products tagged with the others.
She finds:
- L (1,289 products)
- Large (31 products)
- M (1,293 products)
- M (8) (50 products)
- L (9) (62 products)
“L” and “Large” are the same size—but they’re separate filter values. A customer who selects “L” will never see those 31 “Large” gloves.
The parenthetical numbers add another layer of confusion. “M (8)” indicates that glove size 8 corresponds to Medium, useful information if you know your numeric size. But selecting “M (8)” excludes the 1,293 products labeled simply “M.” A customer who selects what looks like the most precise option actually narrows their results more than they intended.
The consequence: Customers filtering by “L” miss products. Customers who try to be precise by selecting “M (8)” miss even more. Some give up on filters entirely and scroll through all 5,500 results instead.
This is a textbook attribute normalization failure. The data arrived from different suppliers with different conventions, and no one standardized it at ingestion.
What Good Looks Like
Compare this to Grainger’s approach:
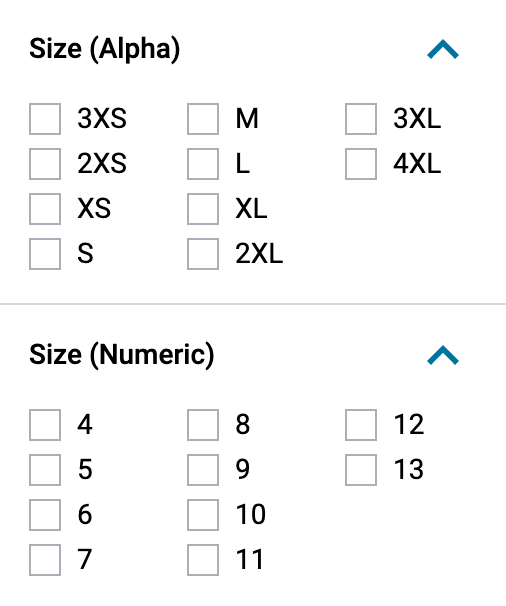
Grainger separates alpha and numeric sizes into two distinct filters. Customers choose the system they know – no guessing, no accidentally excluding products.
Grainger separates “Size (Alpha)” from “Size (Numeric)” as two distinct filters. A customer who knows they’re size 8 can filter directly. A customer who knows they’re Large can filter directly. No guessing. No accidentally excluding products.
This is what deliberate attribute architecture looks like. Someone decided that these were two different ways customers think about size and built the data model to support both.
Problem 4: The “Item” Filter
This is where things get truly confusing.
There’s a filter called “Item” with values like:
- Cut-Resistant Coated Gloves (1,212)
- Cut-Resistant Impact Gloves (161)
- Cut-Resistant Gloves (765)
- Coated Gloves (646)
- Cut Resistant Work Gloves (42)
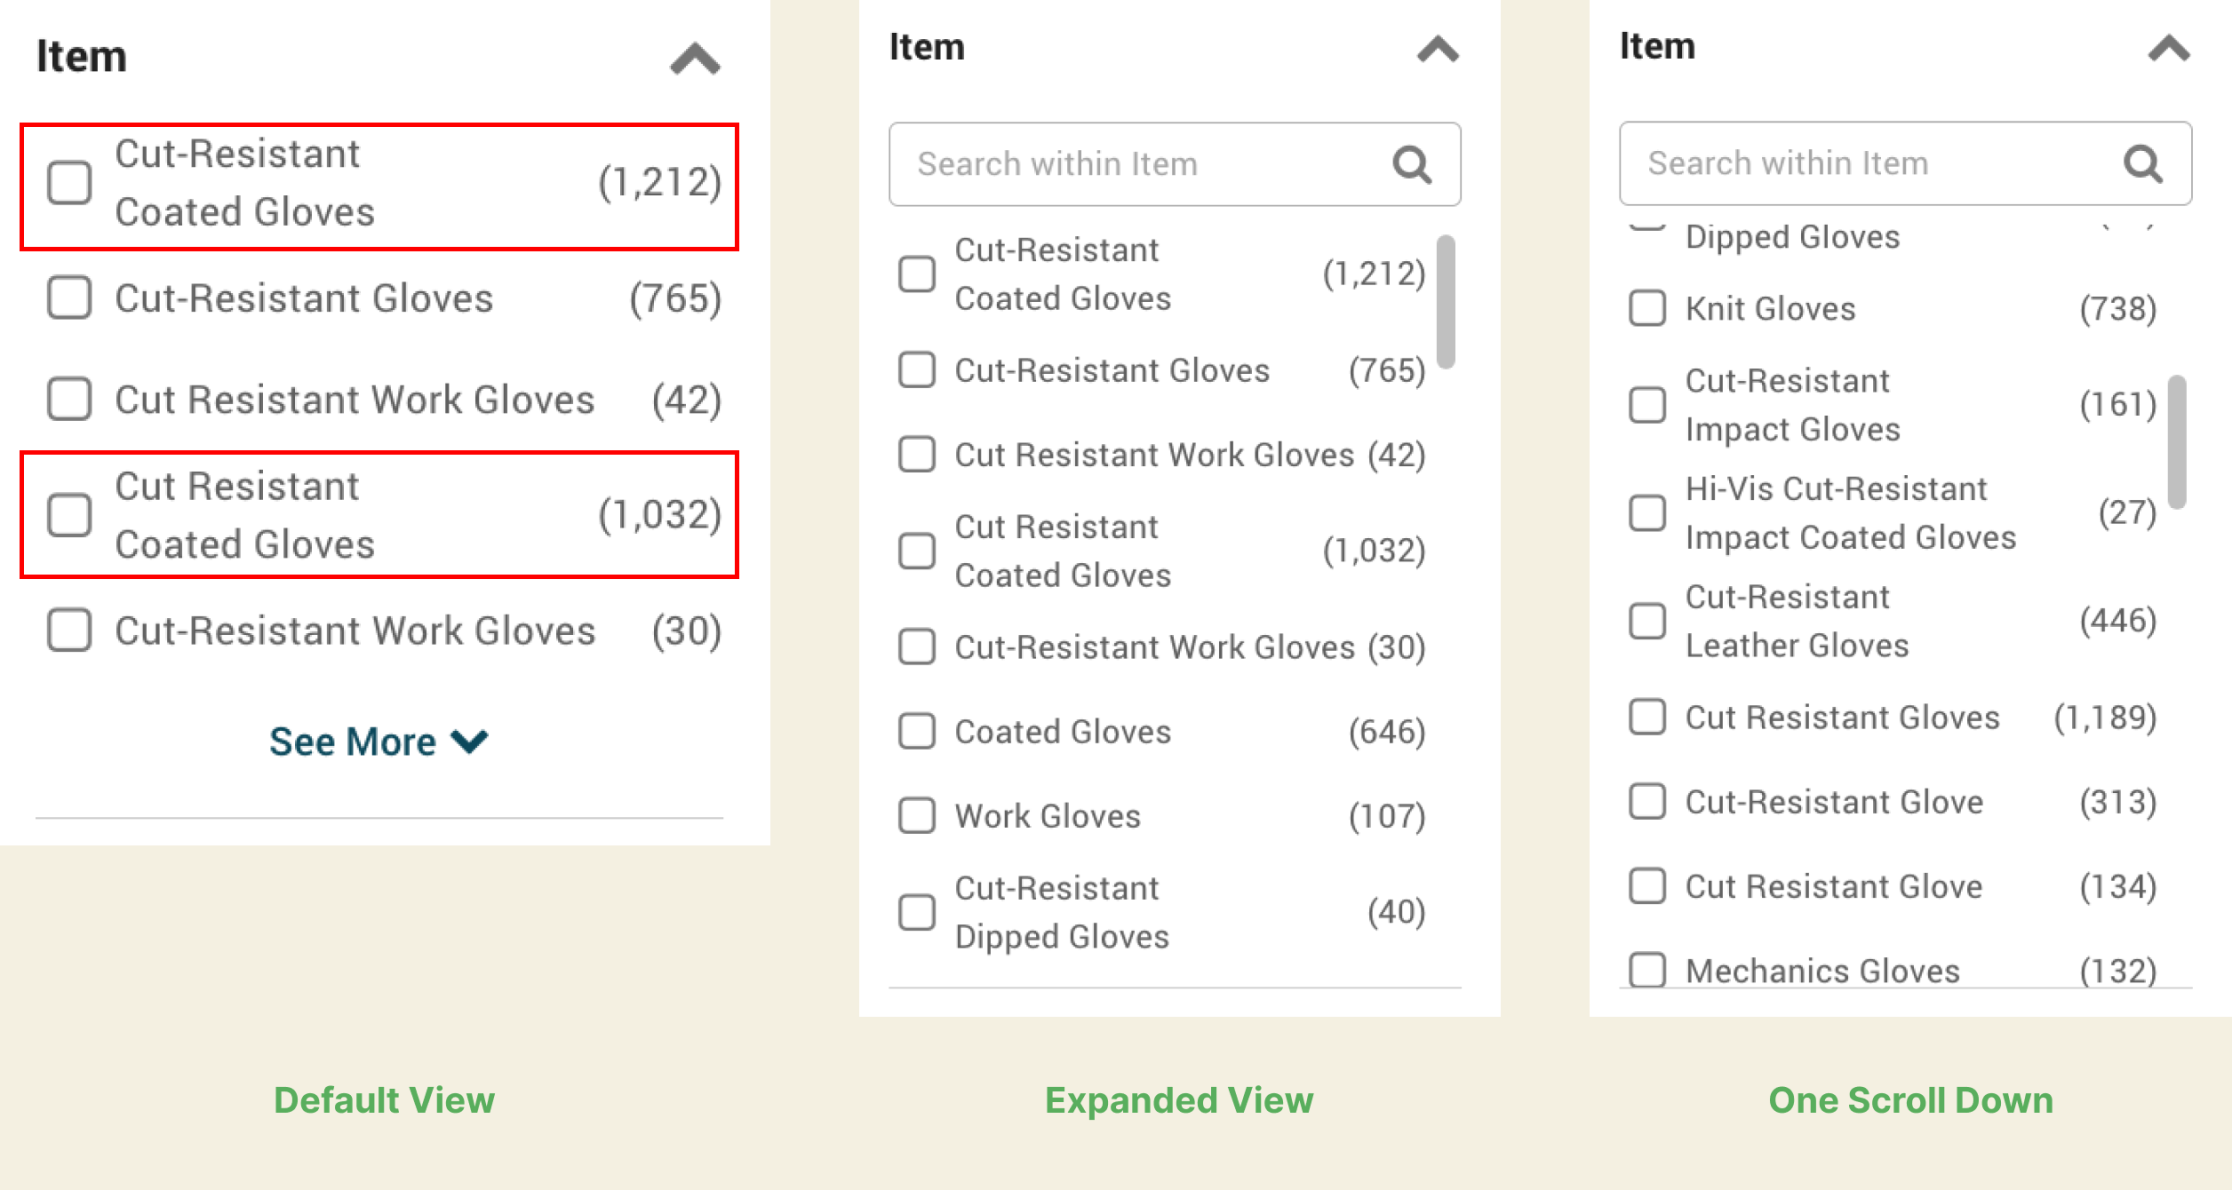
“Cut-Resistant Coated Gloves (1,212)” and “Cut Resistant Coated Gloves (1,032)” are separate filter values. What’s the difference?
What’s the difference between “Cut-Resistant Coated Gloves” and “Cut-Resistant Gloves”? If you select “Cut-Resistant Gloves,” are you excluding coated ones? Are “Coated Gloves” cut-resistant or not?
This filter doesn’t narrow, it confuses. A customer has no basis for choosing between these values. And choosing wrong means missing products without any indication that you’ve done so.
Here’s the critical point: This filter pattern appears across the entire site, not just in gloves.
Safety Glasses
The Safety Glasses “Item” filter includes:
- Safety Glasses (3,699)
- Reader Safety Glasses (378)
- Bifocal Safety Glasses (129)
- Welding Safety Glasses (80)
- Microscope Slide (12) — What is this doing in safety glasses?
- Safety Glasses Holder (7) — An accessory mixed with products
- Sideshield (7)
- Safety Goggles (8)
Electrical Tape
The Electrical Tape “Item” filter includes:
- Insulating Electrical Tape (219)
- Conductive Electrical Tape (140)
- Electrical Tape (44) — How is this different from “Insulating”?
- Vinyl Electrical Tape (15)
- Quick Wrap Tape (9)
- Repair Tape (11)
What’s the difference between “Electrical Tape” and “Insulating Electrical Tape”? If a customer selects “Electrical Tape,” are they excluding the insulating variety?
This isn’t a category-specific oversight. It’s an architectural pattern that creates confusion everywhere. The “Item” field became a dumping ground for product type variations that don’t fit cleanly into the taxonomy and now customers have to navigate the mess.
The result: customers can easily make filtering mistakes they don’t even know they’re making.
Problem 5: Concatenated Colors
Our supervisor doesn’t particularly care about color, but let’s look at this filter anyway—because it illustrates a data modeling problem that appears throughout the catalog.
To find all gray gloves, a customer would need to select multiple values separately.
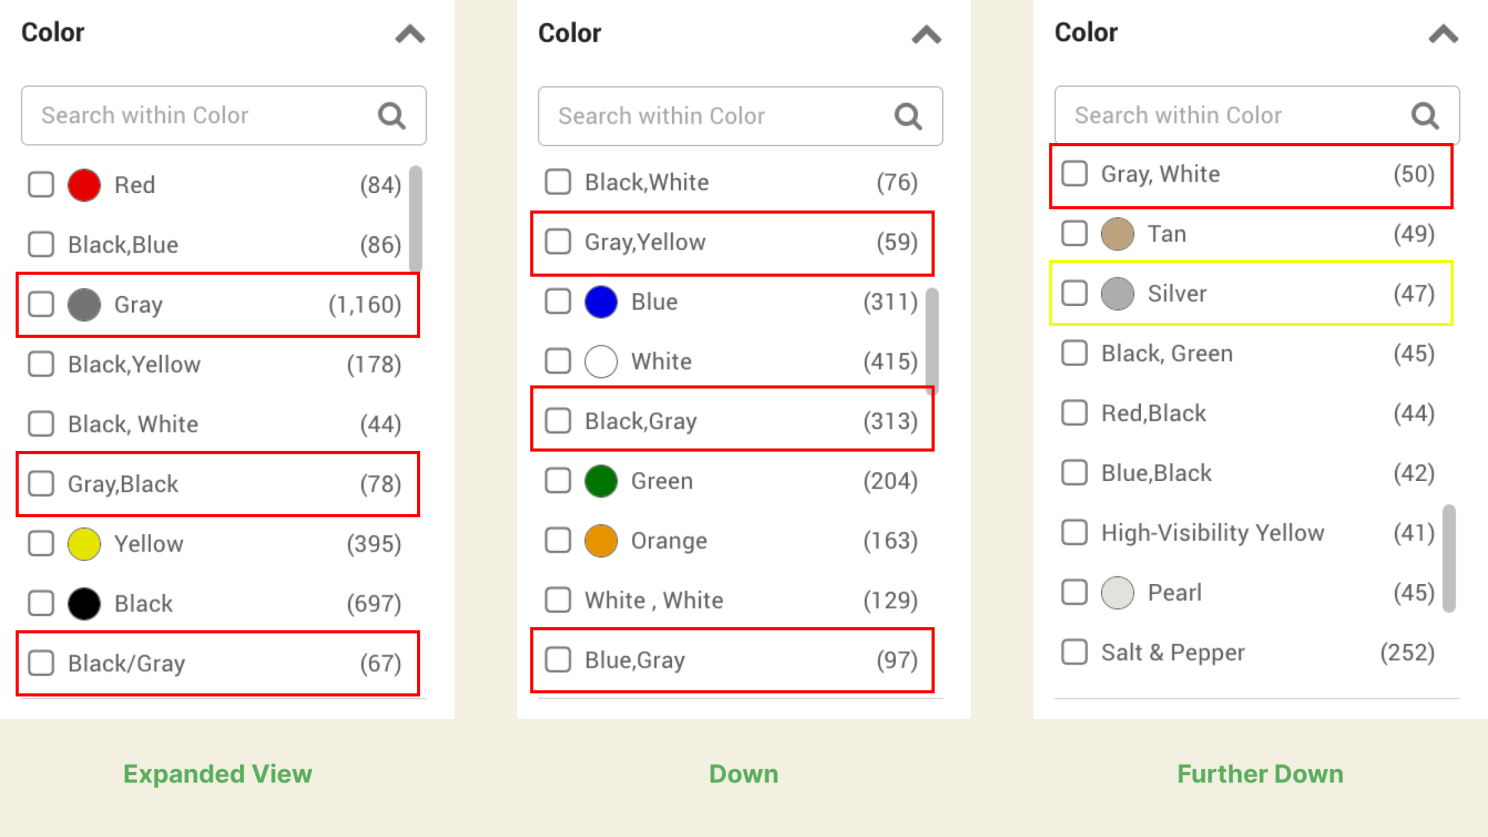
The Color filter lists nearly 100 values, most of them combinations:
- Gray,Yellow (59)
- Green,Black (51)
- Black,Blue (86)
- Red (84)
- Gray (1,160)
Instead of allowing buyers to select multiple colors, every combination becomes its own value. Colors were stored as concatenated strings rather than as a multi-value attribute.
The practical impact: If you want gloves that include gray, you have to know to search for “Gray” (1,160) separately from “Gray,Yellow” (59) and “Gray,Black” and every other gray combination. Select just “Gray” and you’ll miss hundreds of products that are partially gray.
Problem 6: Fragmented Coatings
Now our supervisor returns to her original requirement: nitrile coating. She opens the Glove Coating Material filter.
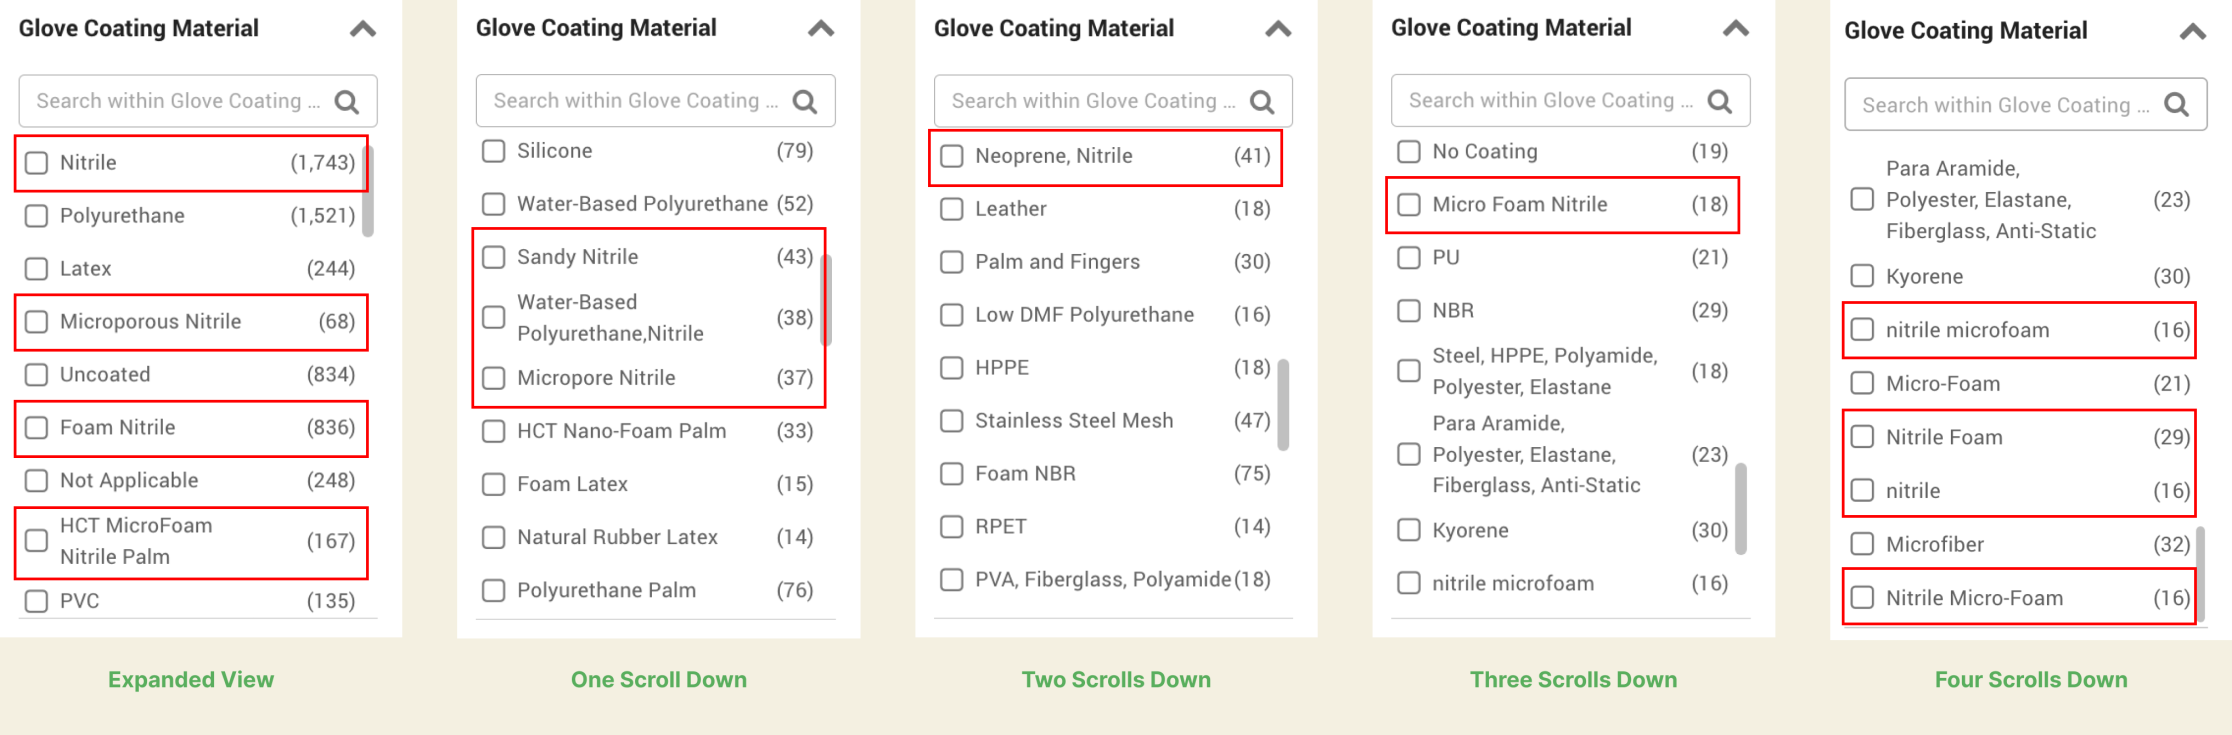
Thirteen distinct filter values contain “nitrile,” including case variations, word-order differences, and near-duplicates like “Microporous Nitrile” and “Micropore Nitrile.”
She finds 13 distinct values containing the word “nitrile”:
- Nitrile
- nitrile
- Foam Nitrile
- Nitrile Foam
- Micro Foam Nitrile
- Nitrile Micro-Foam
- nitrile microfoam
- Microporous Nitrile
- Micropore Nitrile
- Sandy Nitrile
- HCT MicroFoam Nitrile Palm
- Water-Based Polyurethane, Nitrile
- Neoprene, Nitrile
Look at what’s happening here:
“Nitrile” and “nitrile” are separate values – case sensitivity creating duplicates. “Foam Nitrile” and “Nitrile Foam” are separate values – word order creating duplicates. “Micro Foam Nitrile,” “Nitrile Micro-Foam,” and “nitrile microfoam” are three values for what appears to be the same coating type, differing only in spacing, hyphenation, and capitalization. “Microporous Nitrile” and “Micropore Nitrile” are almost certainly the same thing.
To find all nitrile-coated gloves, a customer would need to identify and select all 13 variations, assuming they even notice the duplicates buried in a long filter list.
This isn’t deliberate curation for specialists who need to distinguish coating subtypes. It’s supplier data passed through to customers without normalization. Each manufacturer submitted their products with their own terminology, and no one reconciled the values at ingestion.
The customer pays the price.
The Cumulative Effect
Our maintenance supervisor started with a clear, specific need: A4 cut-resistant gloves, nitrile coated, size large, in stock.
She filters by “In Stock” and “Fast Shipping.”
She still has thousands of products to scroll through.
Every filter she tried either:
- Showed confusing mismatches she couldn’t explain (Category)
- Couldn’t be navigated to find her brand (Brand)
- Couldn’t be trusted to show all relevant sizes (Size)
- Required insider knowledge to interpret (Item)
- Fragmented values she’d need to select multiple times (Color, Coating)
She’s done everything right. She searched. She filtered. She tried to narrow systematically. And she’s still looking at page after page of results with no clear path to the right product.
At this point, she has three options: keep scrolling and hope she spots something suitable, call the distributor’s customer service line and ask for help, or abandon this site and try a competitor.

She’s done everything right. She searched. She filtered. She still can’t find what she needs.
The Revenue You Can’t See
Here’s a thought experiment.
Suppose this distributor sees 10,000 searches for “cut-resistant gloves” per month. Industry benchmarks suggest 20-30% of product searches result in add-to-cart on well-optimized sites. Let’s assume this site converts at 15%, reasonable for B2B with complex filtering needs.
That’s 1,500 add-to-cart events monthly from this single search term.
Now suppose the filter problems we’ve documented cause even 10% of potential buyers to give up, call customer service, or leave for a competitor. That’s 150 lost conversions per month from one product category.
If average order value for cut-resistant gloves is $75, that’s $11,250 in monthly friction – from a single search term that customers are actively trying to convert on.
The specific numbers matter less than the pattern. Even if these estimates are off by half, the friction is real and it compounds across every product category with similar data quality issues. This is revenue loss that doesn’t appear in any report. It shows up as “lower conversion rate” with no clear cause, or as customer service costs that seem irreducible, or as market share that slowly erodes to competitors with better findability.
The customers who abandon don’t complain. They just leave.
What’s Actually Happening
Every one of these problems traces back to the same root cause: product data that was ingested, not architected.
- Supplier data arrived with “L” and “Large” and no one normalized it
- Brand names got added in whatever order they arrived
- Color values were concatenated strings because that’s how the supplier delivered them
- The “Item” field exists because someone needed a place to put product type variations without a governing taxonomy
- Coating materials use whatever terminology each manufacturer prefers, including inconsistent capitalization, word order, and hyphenation
None of this is malicious. It’s the natural result of scaling a catalog without sustained governance.
And none of this is easy to fix. Suppliers don’t standardize. Systems have constraints. Teams have competing priorities. Engineering resources go to features that are easier to measure.
But the customer doesn’t experience your constraints, they experience your catalog. And what they experience is a system that looks helpful but doesn’t work.
The Questions Worth Asking
If you’re looking at your own catalog, here’s where to start:
Does search align with your taxonomy? When a customer searches for a product category by name, do they see the full assortment or a confusing subset?
Are your filter values normalized? Do “L” and “Large” coexist? Are there case-sensitivity duplicates? Are colors stored as strings or multi-value attributes?
Can customers navigate your filters? Are brands alphabetized or sorted by relevance? Would a buyer understand what each “Item” value means without insider knowledge?
How easily can customers make invisible mistakes? Can they accidentally exclude products without realizing it? Does the interface help them recognize when something’s wrong?
Who owns ongoing data quality? Not who fixed it last time, who’s responsible for catching drift before it reaches customers? How are they measured?
How long until your last cleanup degrades? If you invested in data quality two years ago, what does the catalog look like today?
Let’s Talk
These problems don’t show up in quarterly reviews. They show up in abandoned searches, in calls to customer service asking “which glove do I need?”, and in conversion rates that underperform without anyone understanding why.
If you’re recognizing these patterns in your own catalog, I’d welcome a conversation about what’s actually happening and what sustainable governance looks like.
#IndustrialDistribution #B2BEcommerce #ProductData #CatalogManagement
Loading comments...