
Product Data Quality Is Revenue Assurance, Not IT Hygiene
January 30, 2026 · 10 min read
Consider this scenario, one that plays out constantly across mid-market distribution: A contractor searches for a brass ball valve rated for 600 PSI. They go to your site, enter their search terms, apply filters for material and pressure rating. You carry exactly what they need. But the pressure rating field on that SKU is empty—supplier didn’t provide it, got lost in a system migration, never got prioritized for enrichment.
When the contractor filters by pressure rating, your valve isn’t ranked lower. It’s mathematically excluded from results. It doesn’t exist in their search. They see no relevant results, leave, and buy from a competitor. Not because of price, availability, or service. Because your data made your inventory invisible.
This is the problem that doesn’t show up in any standard dashboard: the gap between what you stock and what customers can actually find.
And here’s why it persists: leadership doesn’t see it as a revenue problem. They see it as data hygiene: an IT issue, a governance concern, something you maintain to keep systems running and auditors satisfied. That framing is the problem. It guarantees that product data will always lose budget fights to initiatives with clear revenue projections.
There’s a better frame. Revenue Assurance.
What Revenue Assurance Means
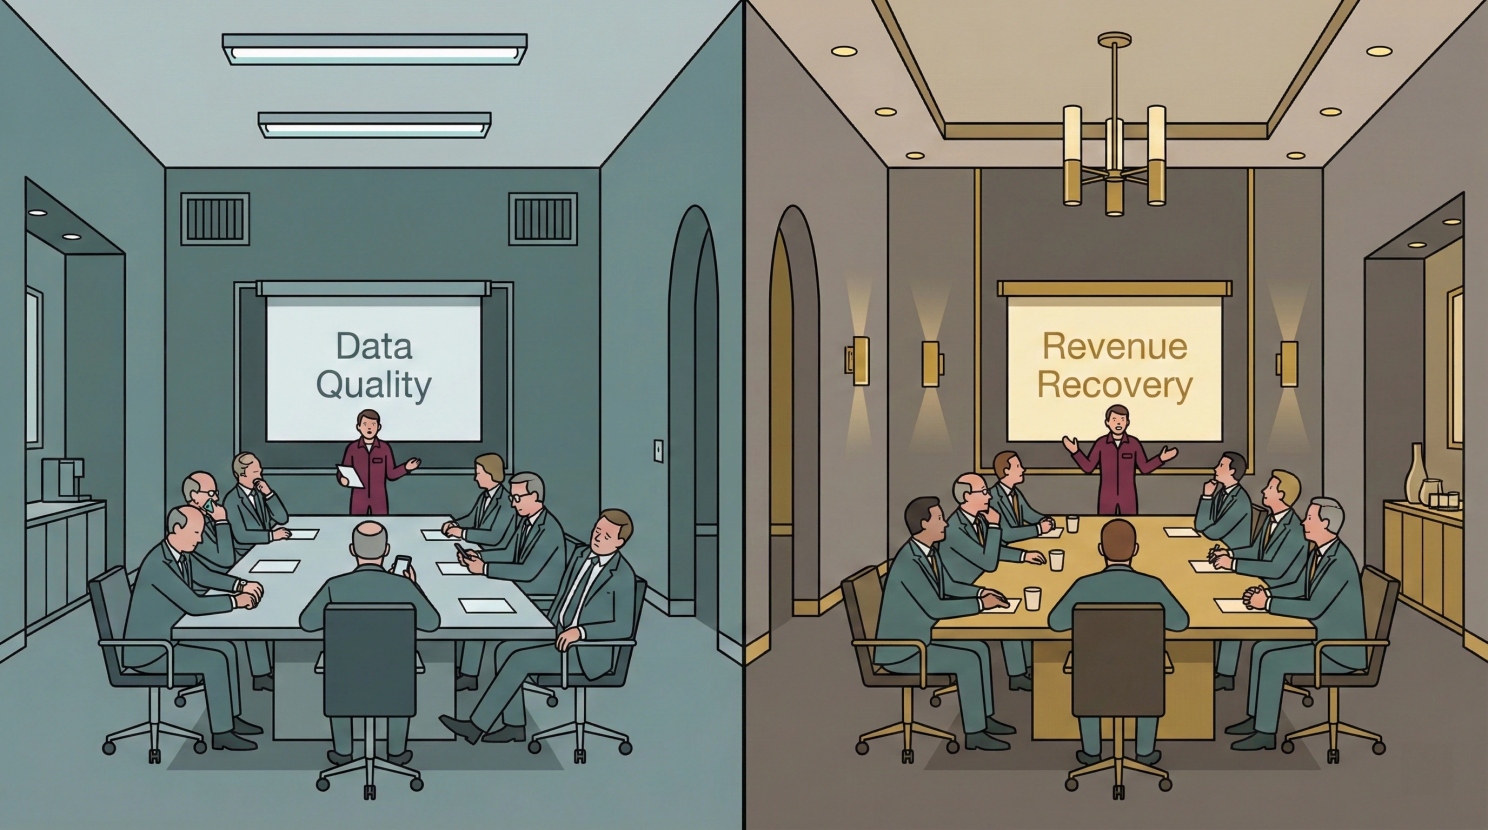
The Budget Fight. Same initiative, different framing. “Data Quality” loses to initiatives with clearer revenue projections, every time. Until you change the framing.
In this context, Revenue Assurance means treating findability failures as revenue leakage: measuring them, assigning commercial ownership, and prioritizing remediation the way you’d prioritize any source of lost margin.
Here’s why the distinction matters. Q4 budget planning. The e-commerce team requests $150K for a data enrichment initiative. The marketing team requests $150K for a demand generation campaign with a projected pipeline of $2M. The CFO looks at both requests. One has a revenue number attached. One has “improved data completeness.”
Demand generation gets funded. Data enrichment gets pushed to next year, or cut to $40K, or folded into “ongoing operations” where it quietly dies.
This isn’t a failure of intelligence. It’s a failure of framing. Data quality positioned as governance will always lose to initiatives positioned as revenue. The frame determines the funding.
But here’s what that data enrichment project actually does when scoped correctly: it converts inventory you’ve already paid for into revenue you’re currently leaking. That’s not hygiene. That’s protecting revenue you’ve already earned the right to make.
Why the Gap Exists
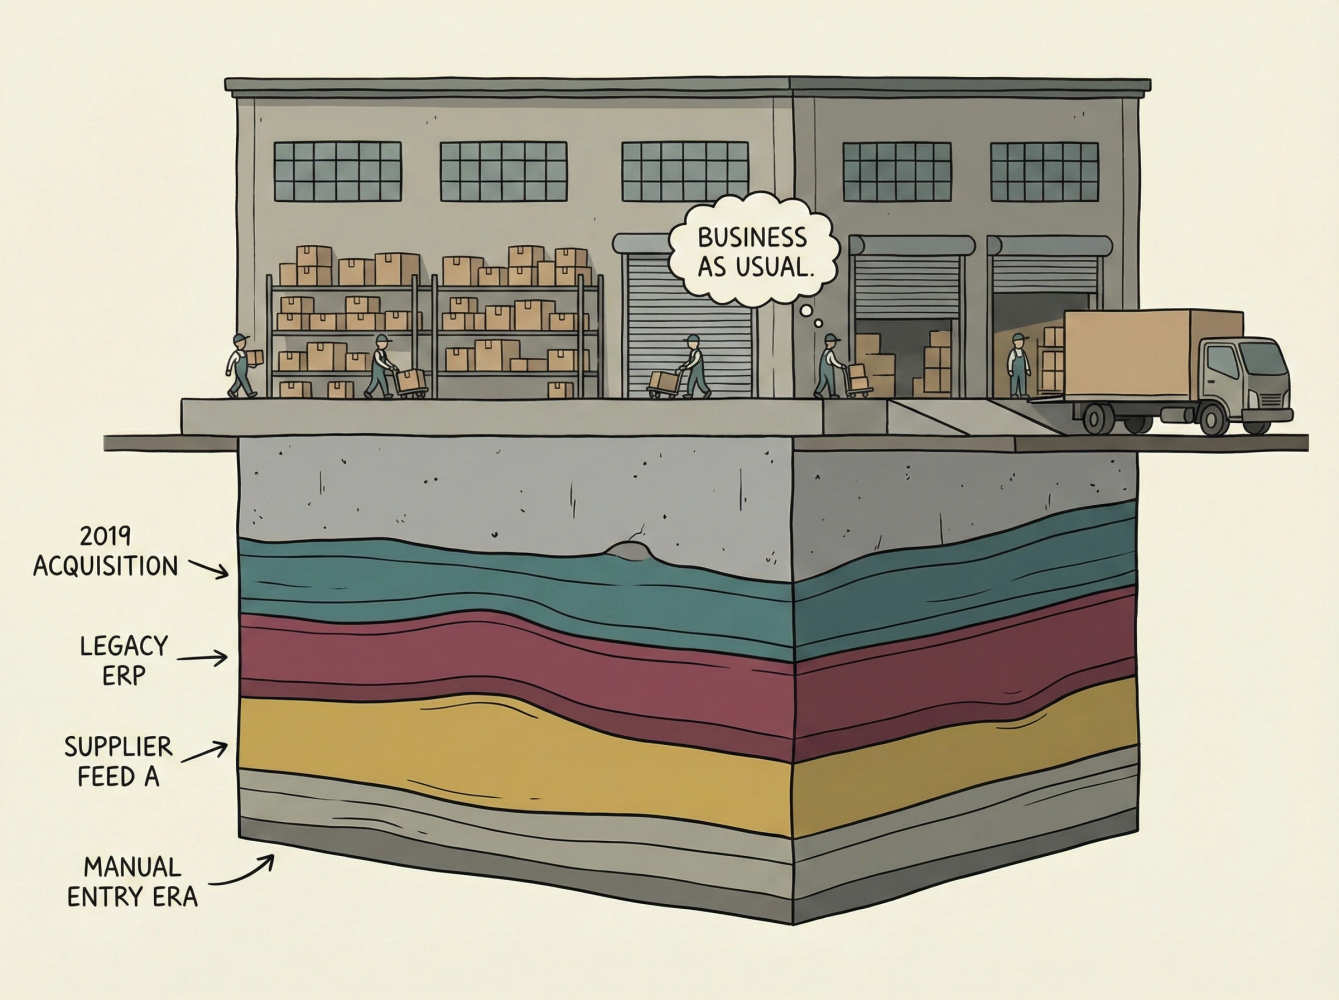
Every acquisition, supplier feed, and system migration adds another layer. The warehouse looks fine from above. The foundation tells a different story.
This problem is endemic to distributors who’ve grown through acquisition, added supplier feeds without normalization, or expanded SKU counts faster than they could enrich product records. The pattern is predictable:
Each acquisition brings a new catalog with different attribute structures, different naming conventions, different levels of completeness. Each new supplier feed arrives with whatever data the supplier chose to provide—often missing the exact attributes your customers filter by. Each SKU expansion adds records that meet minimum listing requirements but lack the enrichment that makes products findable.
The inventory exists. The demand exists. But the data can’t connect them.
From my years in e-commerce operations at Zoro.com—scaling from two million SKUs to fourteen million—I watched this dynamic constantly. When your business model depends on long-tail sales to SMBs, data quality isn’t a problem at the margins. It’s the whole game. Every SKU matters, but no single SKU justifies manual enrichment. The economics only work if you build systems and processes that maintain quality at scale. Most distributors haven’t, because they’ve never had to think about it that way.
And this problem is about to get worse. AI-mediated procurement is coming. Autonomous purchasing agents will query catalogs on behalf of buyers, filtering and comparing products based on structured attributes. When a human searches and gets imperfect results, they might scan the page, click into a product, read the description, and infer that yes, this valve probably handles 600 PSI. An AI agent won’t do that. It will see NULL in the pressure rating field and move on to the next supplier. There’s no benefit of the doubt, no “close enough.” The window for incomplete data to slide by on human intuition is closing.
How to Measure Your Exposure

You can’t prioritize what you haven’t mapped. The diagnostic turns unknown territory into actionable findings.
Calling it Revenue Assurance only matters if it changes behavior. Here’s where it does: what you measure and how you prioritize.
There are three diagnostic approaches that connect data quality to commercial impact. In order of where I’d start:
Start here: Zero-results analysis. Pull your top 100 zero-results queries from the last 30 days. Cross-reference them against your actual catalog. Categorize each one:
- True zero: You don’t carry it. Customer wanted something outside your assortment.
- Terminology mismatch: You carry it, but they searched “shutoff valve” and you list it as “ball valve.”
- Attribute gap: You carry it, but filtering failed because data was missing or inconsistent.
The third category is your Revenue Assurance exposure, quantified. For distributors who haven’t done systematic enrichment work, this category often accounts for 15-30% of zero-results queries. If yours is under 10%, you’re ahead of most.
Second: Filter-to-coverage ratio. Pull your top 10 most-used search filters by category. Check what percentage of SKUs in that category have values populated for those filters. If customers filter by “voltage” in 40% of sessions and 30% of your products don’t have voltage specified, those products are invisible to nearly half of buying sessions in that category.
Third: Bounce rate by completeness. Segment product page bounce rates by attribute completeness, pages where all key specs are populated versus pages missing critical fields. A significant spread (say, 60% bounce on incomplete listings versus 35% on complete) gives you both signal and a rough way to estimate conversion impact.
Many mid-market distributors discover they can’t easily pull any of these reports. That’s not a failure, it’s information. If you can’t measure the gap between what you stock and what customers can find, you’re making inventory investments without knowing whether they’ll convert.
What Good Looks Like

Findability as an operational discipline: measured continuously, maintained systematically, connected to the floor.
A distributor who’s solved this problem doesn’t look radically different from the outside. The differences are operational:
They measure findability, not just completeness. What percentage of SKUs in each category are discoverable via the top customer search patterns for that category? When a category drops below a threshold, it triggers remediation, not as a special project, but as part of ongoing operations.
They’ve built data quality into supplier onboarding. New suppliers don’t get listed until their product data meets minimum thresholds for the categories they’re entering. This creates friction—some suppliers push back—but it stops the bleeding. They’re no longer adding data debt faster than they can pay it down.
They’ve assigned commercial ownership. The team responsible for catalog data reports to merchandising or e-commerce, not IT. Their goals include conversion rate and zero-results rate, not just records processed. When data quality affects their numbers, they have standing to prioritize it.
This isn’t a one-time project with a launch date. Catalogs degrade by default. Every acquisition, every new supplier feed, every SKU expansion introduces new data debt. The companies that sustain progress treat data quality the way they treat inventory accuracy: something measured continuously and addressed systematically.
Starting the Internal Conversation
If you’re a VP of E-commerce or Digital, your challenge isn’t understanding the problem. It’s getting traction internally.
Your ally is usually the CFO or head of merchandising—whoever feels the pain of inventory that isn’t turning. The pitch: “We have capital tied up in products customers can’t find. I can measure the gap and show you where we’re leaking revenue we’ve already invested to earn.”
Your friction point is often IT—not opposition, but a tendency to frame this as a platform problem before it’s been diagnosed as a business problem. You don’t need a PIM to measure your exposure. You need search logs, catalog data, and a clear methodology. Start with the diagnostic. Let findings determine whether you need technology, process changes, or both.
The three-sentence version for your CEO: “We’re investing in inventory that customers can’t find because our product data has gaps. I can measure exactly where and how much. This is recoverable revenue, not a cost center … if we treat it that way.”
The Investment Frame
For a distributor with 50,000-200,000 SKUs, getting from “we don’t know” to “we understand our exposure and have a prioritized remediation plan” typically requires 2-4 weeks of focused work. The variation depends on SKU count, data complexity, and how accessible your search analytics and catalog data are.
What does that diagnostic produce? Three things: a quantified view of your findability gaps by category, a prioritized remediation roadmap based on commercial impact rather than completeness scores, and a clear recommendation on whether you need technology investment, process changes, or both.
The mistake I see most often in the industry: skipping measurement and jumping to a platform purchase or enrichment contract. If you don’t know where the gaps are and which ones matter commercially, you’ll spend money on completeness that doesn’t move conversion. Measure first. Then invest.
The Point
Your product data is either making inventory visible and sellable, or it’s creating a gap between what you’ve invested in and what you can convert.
Revenue Assurance means measuring that gap, assigning commercial ownership, and prioritizing it the way you’d prioritize any other source of revenue leakage. The CFO already has a mental model for protecting revenue the company has earned. This fits.
The question isn’t whether you have this problem—nearly every distributor who’s grown faster than their data operations does. The question is whether you’ve measured it. Once you have, the priority tends to become obvious.

The valve was always there. Now it’s findable.
Loading comments...